
Updated August 6th, 2026
Have you ever read a radiology report of a CT scan or discussed such a case with a radiologist? If so, chances are high that you have read or heard the word attenuation. This article will give you information to understand what attenuation means in the radiology setting. So to get directly to the point: What does attenuation mean in radiology?
In short
- Attenuation is the loss of X-ray beam intensity as it passes through tissue. On CT it is expressed in Hounsfield units, a scale anchored at air (−1000) and water (0).
- Fat runs −120 to −60 HU, muscle and spleen 35 to 55, liver 40 to 70, acute blood 60 to 90, calcification above 130.
- A handful of cut-offs end a differential on their own: 10 HU or less for a lipid-rich adrenal adenoma, −10 HU or less for macroscopic fat, an increase of 20 HU or more for true enhancement.
- Values shift with tube voltage, reconstruction kernel and scanner calibration, most noticeably for iodine and calcium.
- Partial volume averaging pulls a measurement towards whatever sits next to it. A thin, central region of interest matters more than the number it produces.
Hounsfield unit values you can work from
Attenuation only becomes useful once it has a number attached. The Hounsfield scale is anchored at two points, air at minus 1000 and water at zero, and everything else follows from there. The ranges below are the ones worth carrying in your head.
| Tissue or material | Hounsfield units |
|---|---|
| Air | −1000 |
| Lung parenchyma | −900 to −500 |
| Fat | −120 to −60 |
| Water | 0 by definition |
| Simple fluid, urine, bile | −10 to +15 |
| Kidney, unenhanced | 20 to 45 |
| White matter | 20 to 30 |
| Grey matter | 37 to 45 |
| Muscle, spleen | 35 to 55 |
| Blood, unclotted | 35 to 55 |
| Liver | 40 to 70 |
| Acute haematoma, clotted blood | 60 to 90 |
| Thyroid gland | 70 to 110 |
| Calcification | above 130 |
| Cancellous bone | 300 to 800 |
| Cortical bone | 800 to 1900 |
| Metal implants | above 3000 |
Attenuation in Radiology: The Brief Explanation
Attenuation refers to the diminishing intensity of an X-ray beam as it passes through a substance.
The decrease in intensity can arise from either absorption or the deflection (scatter) of photons within the beam. Various factors, including beam energy and the atomic number of the absorber, can influence this phenomenon.
Attenuation in Radiology: The Slightly More Complex Explanation
“Attenuation” in radiology refers to the reduction in the intensity of a beam of radiation as it passes through a substance. This phenomenon occurs when X-rays or other forms of electromagnetic radiation encounter and interact with different materials in the human body. The term is crucial in understanding how radiation behaves during the imaging process.
How is “Attenuation” Used in Radiology?
In radiology, “attenuation” is a key concept used to describe the changes in radiation intensity as it traverses through the body tissues. This is particularly relevant in computed tomography (CT) scans (such as photon-counting CT), where X-ray beams are directed through the body, and detectors measure the radiation that emerges on the other side.
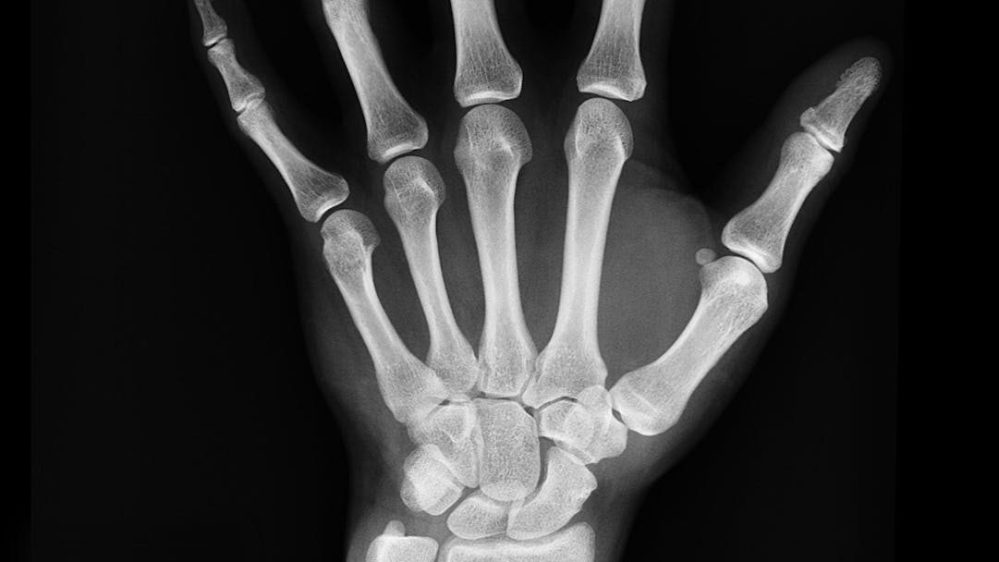
Attenuation is affected by the density and composition of tissues. Dense tissues, such as bones, attenuate X-rays more than less dense tissues, like muscles or organs. Understanding attenuation is essential for creating detailed and accurate images. Variations in attenuation contribute to the contrast seen in radiographic images.
Which Tissues Have Higher or Lower Attenuation?
Dense materials (bone, metal, iodinated contrast) with high atomic numbers have higher attenuation. In contrast, materials with lower density (water, soft tissue, air) have lower attenuation.
As a rule of thumb, tissue with high attenuation appears brighter on a CT image whereas areas with low attenuation appear darker. If you have trouble distinguishing the two, think of the black color of the air surrounding the patient in CT images. Air has almost no attenuation

Origin of the Term “Attenuation” in Radiology
The term “attenuation” has its roots in Latin, where “attenuare” means to make thin or slender. In the context of radiology, it describes thinning or weakening of the X-ray beam as it passes through different anatomical structures.
Examples of Using the Term “Attenuation” in Radiology
- CT Head Scan: When investigating a patient with a suspected brain injury, understanding the attenuation of X-rays helps in distinguishing between different brain tissues and identifying potential abnormalities. For example, areas of higher attenuation within the skull may indicate intracranial hemorrhage.
- Abdominal CT with Contrast: Attenuation plays a crucial role when contrast agents are used. Contrast-enhanced imaging relies on differences in tissue attenuation to highlight blood vessels and abnormalities in organs. In more detail, if you read a liver in such a CT scan (of a cancer patient) and there are darker (more attenuating) areas with blurred edges, you need to think of liver metastases.
- Bone Density Measurements: In dual-energy X-ray absorptiometry (DXA) scans, attenuation is utilized to assess bone density, aiding in the diagnosis of conditions like osteoporosis. In these scans, the attenuation directly correlates with the bone density. More attenuation means more bone.
Attenuation in Radiology – The Conclusion
In conclusion, “attenuation” in radiology is a fundamental concept that influences the quality and diagnostic value of medical images. It involves the reduction of radiation intensity as it interacts with various tissues in the body, providing crucial information for radiologists and other healthcare professionals. Understanding attenuation is vital for interpreting images accurately and making informed clinical decisions. So, the next time you encounter this term in the realm of radiology, you’ll have a clearer understanding of its meaning and significance.
Further reading:
- Pros and cons of being a Radiologist
- What does “STAT” mean in Radiology?
- What is kVp in Radiology? Simply Explained
The thresholds that actually decide cases
Knowing that fat is negative and bone is positive changes nothing in a report. What changes a report is a handful of cut-offs where a single number ends the differential.
| Finding | Cut-off | Meaning |
|---|---|---|
| Adrenal nodule | 10 HU or less | Lipid-rich adenoma, no workup |
| Any lesion | minus 10 HU or less | Macroscopic fat: AML, lipoma |
| Renal lesion | minus 10 to plus 20 | Simple cyst, Bosniak I |
| Renal mass | plus 20 HU or more | True enhancement, solid |
| Coronary artery | 130 HU | Agatston scoring threshold |
| Brain | 50 to 70 HU | Acute haemorrhage |
| Pleural fluid | above 20 HU | Exudate, blood or infection |
One practical warning about all of these: they assume a properly calibrated scanner and a sensible region of interest. A 12 HU adrenal nodule measured on a 3 mm slice through the edge of the lesion is not a 12 HU adrenal nodule. Partial volume averaging pulls values towards whatever sits next door, which is why a thin, central measurement matters more than the number it produces.
Attenuation is what makes CT possible: one physical property, measured from many angles, reconstructed into a number per voxel. MRI works from an entirely different property and needs a different mental model, and that model is where most residents get stuck. If you want to build it properly rather than memorise sequence names, the interactive MRI course starts at a single hydrogen nucleus and ends at a real scanner protocol.
And since iodine is the reason half of these numbers move: the thyroid takes up iodine too, which is why a contrast-enhanced CT has consequences beyond the images. The thyroid decision tool covers who needs a TSH before the injection.
And since iodine is the reason half of these numbers move: the thyroid takes up iodine too, which is why a contrast-enhanced CT has consequences beyond the images. The thyroid decision tool covers who needs a TSH before the injection.
Frequently asked
What does attenuation mean in radiology?
Attenuation is the reduction in intensity of an X-ray beam as it passes through matter, caused mainly by photoelectric absorption and Compton scattering. Dense structures attenuate more and appear white on a radiograph or bright on CT.
What is a Hounsfield unit?
A Hounsfield unit is the standardised measure of attenuation on CT. The scale is defined so that air is −1000 and water is 0. It was introduced with the first clinical scanner and is named after Godfrey Hounsfield.
What HU value indicates an adrenal adenoma?
An unenhanced attenuation of 10 HU or less indicates a lipid-rich adrenal adenoma and generally requires no further workup. The threshold comes from a pooled analysis of the CT literature published in 1998.
What HU value counts as calcification?
Above roughly 130 HU. That value is also the threshold used to define calcified plaque in Agatston coronary calcium scoring.
Why do my HU measurements differ between scanners?
Attenuation depends on the photon energy spectrum, so tube voltage changes the measured value, particularly for iodine and calcium. Reconstruction kernel and scanner calibration contribute as well. Compare against your own department values rather than published ranges.
Is hyperdense the same as high attenuation?
In practice yes. Hyperdense, hyperattenuating and high attenuation are used interchangeably to describe a structure that is brighter than its surroundings on CT, although attenuation is the physically correct term.
References
- Hounsfield GN. Computerized transverse axial scanning (tomography): Part 1. Description of system. Br J Radiol 1973;46:1016–1022. doi:10.1259/0007-1285-46-552-1016
- DenOtter TD, Schubert J. Hounsfield Unit. In: StatPearls. StatPearls Publishing, Treasure Island (FL). full text
- Boland GW, Lee MJ, Gazelle GS, Halpern EF, McNicholas MM, Mueller PR. Characterization of adrenal masses using unenhanced CT: an analysis of the CT literature. AJR Am J Roentgenol 1998;171:201–204. doi:10.2214/ajr.171.1.9648789
- Silverman SG, Pedrosa I, Ellis JH, et al. Bosniak Classification of Cystic Renal Masses, Version 2019: An Update Proposal and Needs Assessment. Radiology 2019;292:475–488. doi:10.1148/radiol.2019182646
- Israel GM, Bosniak MA. How I do it: evaluating renal masses. Radiology 2005;236:441–450. doi:10.1148/radiol.2362040218
- Agatston AS, Janowitz WR, Hildner FJ, Zusmer NR, Viamonte M Jr, Detrano R. Quantification of coronary artery calcium using ultrafast computed tomography. J Am Coll Cardiol 1990;15:827–832. doi:10.1016/0735-1097(90)90282-T
